Keep totals separate
Search and top-100 filters narrow the creative list. They do not silently change the denominator for campaign-wide performance.
Case 02 · GMV Monitor / Advertising Analytics
GMV means gross merchandise value: the total value of transactions.
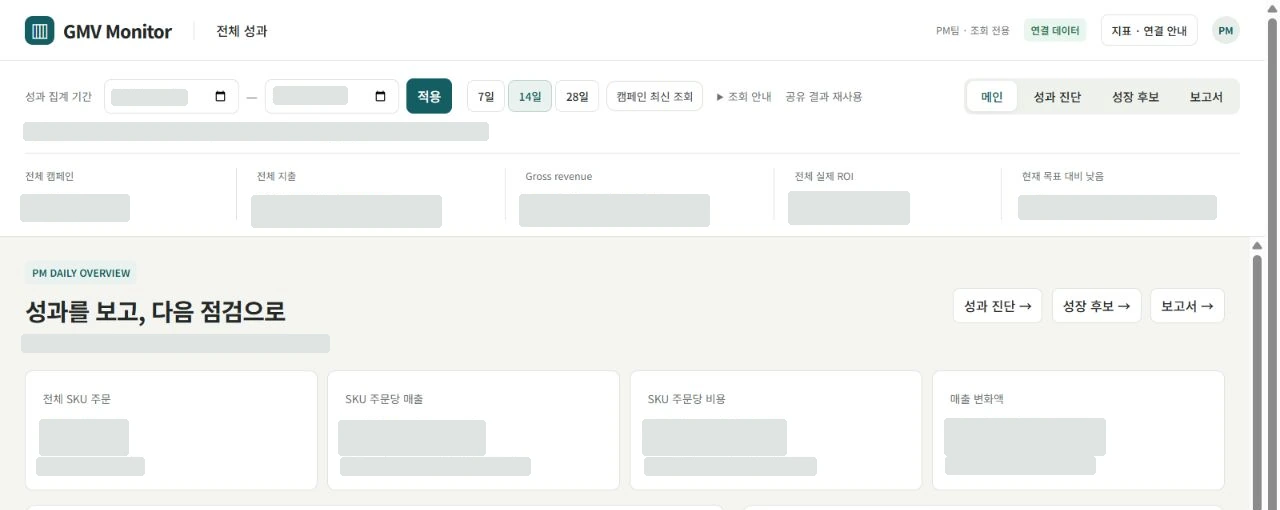
An aggregate ROI cannot tell a team which creative to inspect. The product moves from an overview to a focused shortlist, then to the content behind the numbers.
Review campaign performance and changes
Narrow creatives with search and spend filters
Compare video context and daily trends
Export consistent summaries and CSV reports
Settings, results and content stay connected, with an information hierarchy that works across desktop and mobile.
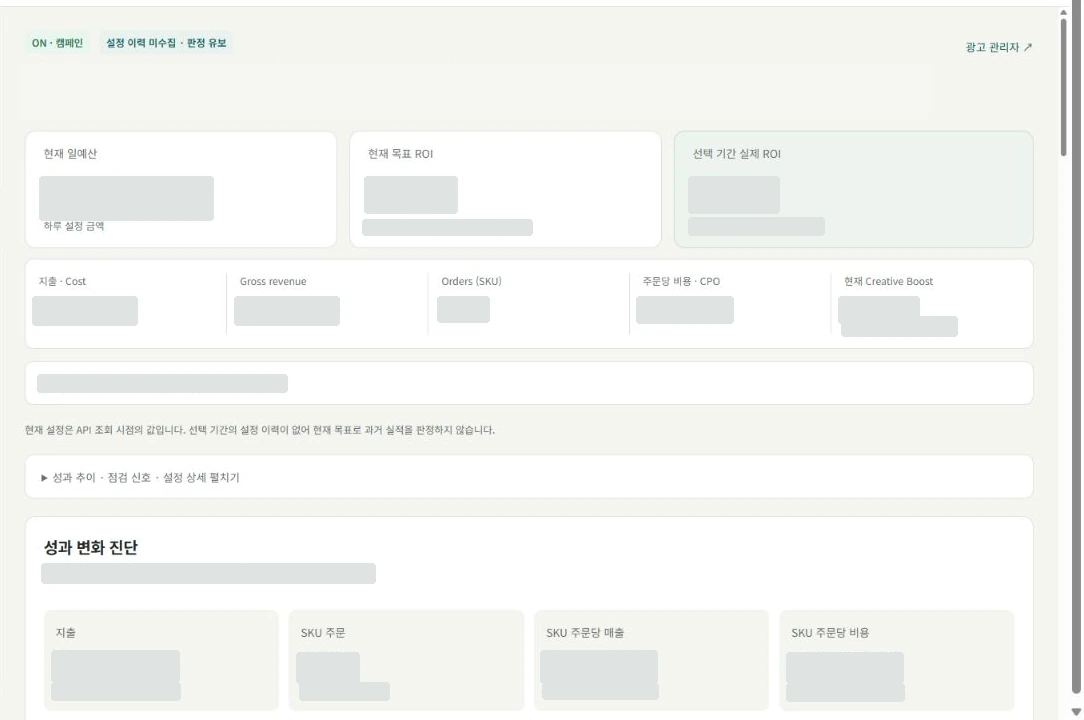
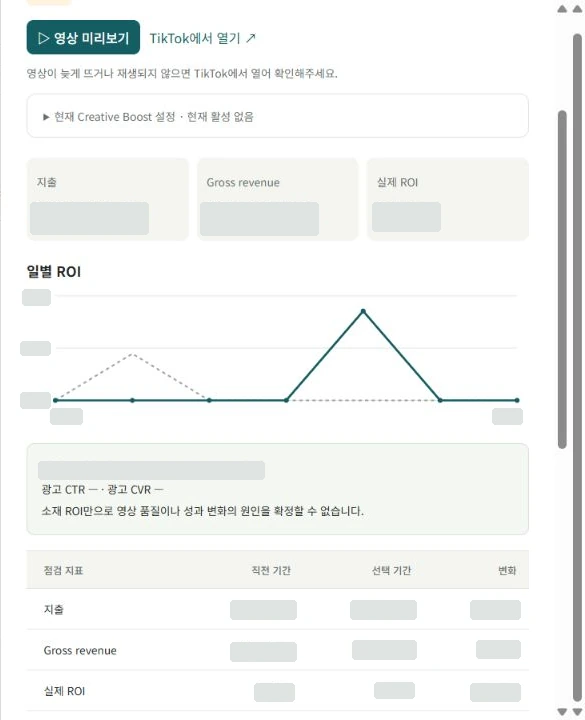
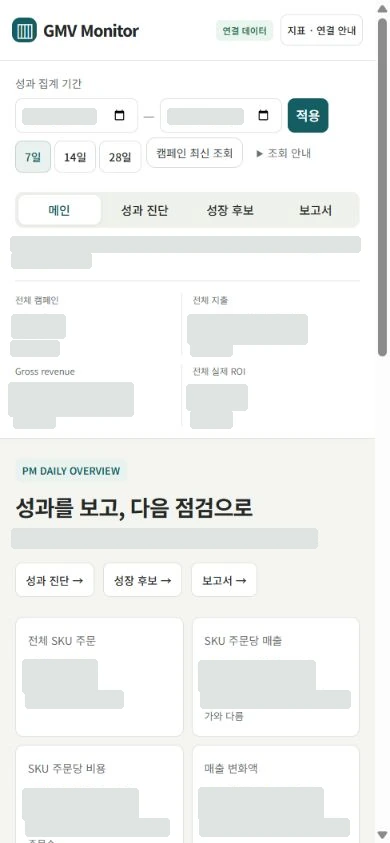
A useful dashboard also prevents misleading interpretations. Data definitions and decision boundaries are part of the product.
Search and top-100 filters narrow the creative list. They do not silently change the denominator for campaign-wide performance.
Unavailable data and errors remain unknown, not zero. Current targets are not retroactively applied to historical results without setting history.
The app focuses on querying, analysis and reporting. A person reviews the evidence and makes advertising changes in TikTok.
AI assisted implementation and review. At runtime, official data is collected and calculated in code; advertising decisions remain with the operator.
The official API rejected a daily-dimension and video-filter combination. The feature needed a different supported query path.
Query supported period reports, match the same video and preserve daily results separately from the period report.
In the recorded sample, daily spend and order totals matched the period report. A small revenue difference was retained rather than overwritten.
Based on the recorded integration check in the detailed case study. This sample does not establish agreement for every campaign or period.
Show campaign performance first, then request selected creatives and daily results on demand. Reuse only validated, complete results to address correctness and repeat-query latency together.
Observed server execution times: first collection versus a cached repeat query for the same feature. These are sample observations, not end-to-end page times or multi-user averages.
I led AI-assisted development by connecting requirements, priorities and acceptance criteria, then checking the output against actual screens and data.
Turn PM requirements into features and flows. Choose official data, a read-only scope and usability priorities.
Use Codex and review agents across collection, caching and UI. Improve the product through observed errors and feedback.
Use recorded results from 286 passing regression tests, live-data and CSV reconciliation, and browser checks to assess behavior and performance.
A product that connects operational understanding, information design, official data integration, performance and data integrity.
Grounded in app captures, development records and verification results. The 286 tests refer to a recorded passing regression run. Deployment and live queries with the administrator account are documented. Colleague mobile access and multi-user concurrency remain to be validated. About 34K rows does not mean unique videos. No ad revenue uplift or team time-saving percentage is attributed to the app. Initial large collections still have latency.